
Feed and speed charts are the shop wall's quickest reference: glance up, find your material and tool size, and dial in a starting point instead of guessing. But a chart is only useful if it reflects how the machine actually cuts, and a poster full of numbers nobody trusts ends up as decoration. Building your own display charts, tuned to your tooling and machines, beats any generic download.
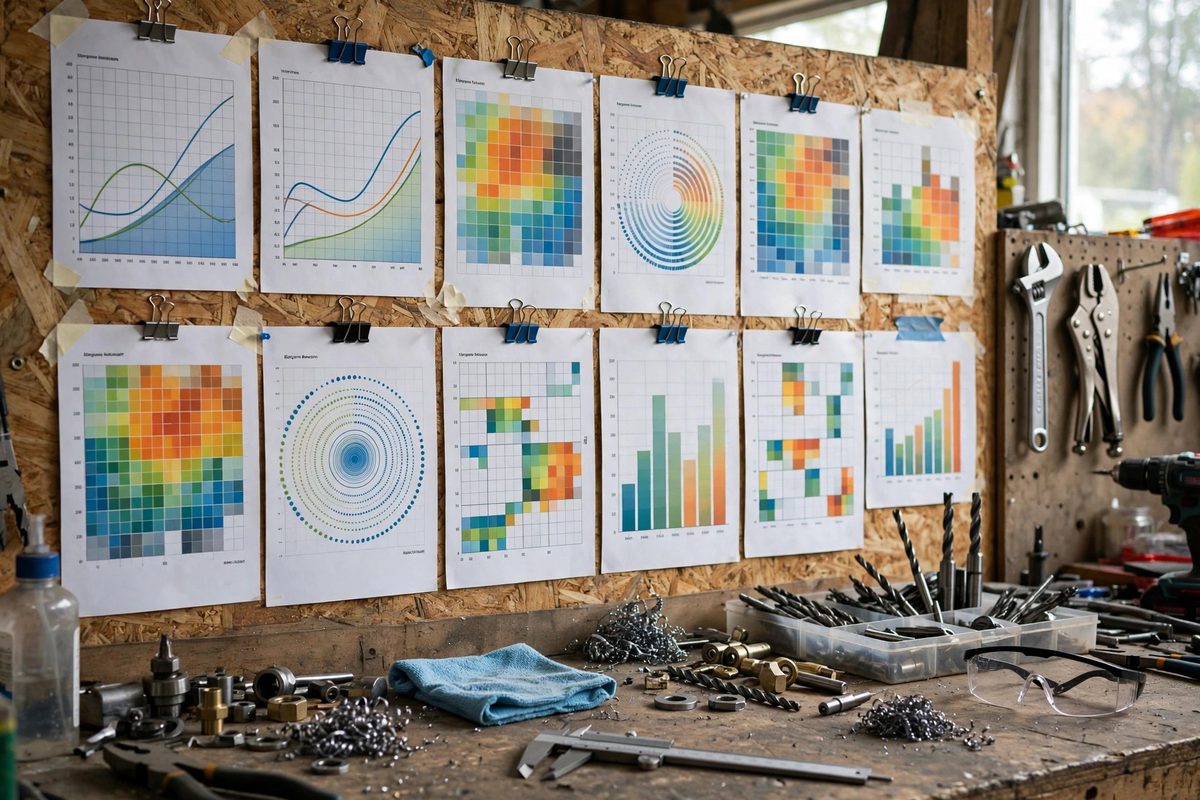
What the Chart Should Show
At minimum, a useful chart maps material, tool diameter, and operation to a surface speed and a feed per tooth or per revolution. Surface speed (SFM in imperial, meters per minute in metric) is the speed of the cutting edge through the material; multiply it by roughly 3.82 and divide by the tool diameter in inches to get spindle RPM. Feed per tooth then converts to inches per minute through the number of flutes. You do not need to derive these on the wall; you need a table that hands you the answer in thirty seconds.
Organize by Operation, Not by Machine
Separate charts for drilling, end milling, and turning prevent the classic error of reading a drill number off a milling column. A drill chart lists twist drill diameter against material with RPM and inches per revolution. A milling chart lists tool diameter with SFM and chip load per tooth by flute count. A lathe chart lists diameter ranges with turning speeds and facing feeds. Keep each chart to one page. If a table needs a second page, it is too ambitious; split it into separate charts and hang them side by side.
Start Conservative, Then Tune
Charts are starting points, not commandments. Print your starting values about 20 to 30 percent below the theoretical maximum, because real shops have real variables: worn spindles, flexing workholding, and inserts that have seen better days. Add a blank column labeled "our shop" next to the printed numbers, and pencil in what actually worked for your machine. Within a few months that column becomes the most valuable data in the shop, and it is the reason a handmade chart outperforms a generic one.
Design for Glanceability
Wall charts fail when they are designed like documents instead of tools. Use large type, high contrast (black on white or white on black), and generous spacing between rows. Color-code the material groups: steel in one color, aluminum in another, plastics and wood in a third. Laminate the finished chart or slide it into a sheet protector so it survives coolant mist and shop dust. Hang charts at eye level next to the machine they serve, not in one central location you have to walk to.
Include the Formulas, Small
Every chart should carry a small footer with the two or three formulas behind it: RPM from surface speed, feed rate from chip load, and metric conversion factors. Nobody memorizes these, and having them printed removes the phone-googling habit that leads to questionable numbers. A compact formula block also lets anyone sanity-check a chart value that looks wrong, which is exactly the habit you want on the floor.
Review and Update Schedule
Treat wall charts as living documents. When new tooling arrives or a machine gets a spindle rebuild, revisit the numbers. When an operator dials in a better set of parameters, write them into the "our shop" column immediately, before the knowledge walks out the door. Dated revision stamps in the corner of the chart tell everyone at a glance whether the numbers are current. A chart with last year's pencil corrections is a record of a shop that is learning; a pristine five-year-old chart is usually one that everyone ignores.
The best feed chart is the one your people actually trust, and trust comes from numbers that match what the machine does. Build the chart, tune it against reality, laminate it, and hang it where the work happens. That laminated page will save more broken tools than any lecture ever will.
Related Guides
- Feed and Speed Reference Charts for Shop Displays: Every shop with a mill, lathe, or drill press needs feed and speed numbers at the point of use, not buried in a handbook across the room. A wall
- Standard Tap and Drill Clearance Chart Typography: A tap and drill chart is one of the most consulted references in any shop that cuts threads, and also one of the most abused by bad typography. A
- Standardizing Machine Speed Reference Cards for Walls: Every shop with rotating machinery needs the same information within arm's reach: the right spindle speed for the material, the tool, and the
- Metric to Imperial Machine Conversion Dial Chart Layouts: Many shop machines speak metric while the project speaks imperial, or the reverse. A conversion dial chart, a circular slide-rule-style reference