
Optical density, the workhorse measurement of home chemistry and biology builds, tells you how much light a sample absorbs, which in turn tells you concentration, growth, or reaction progress. But the number on the display is only as honest as the calibration behind it. Vials vary, instruments drift, and the relationship between absorbance and concentration bends at the extremes. Calibrating properly, with blanks, standards, and an understanding of the linear range, turns a spectrophotometer from a gadget that shows numbers into an instrument that measures. This guide covers the calibration discipline for vial-based readings.
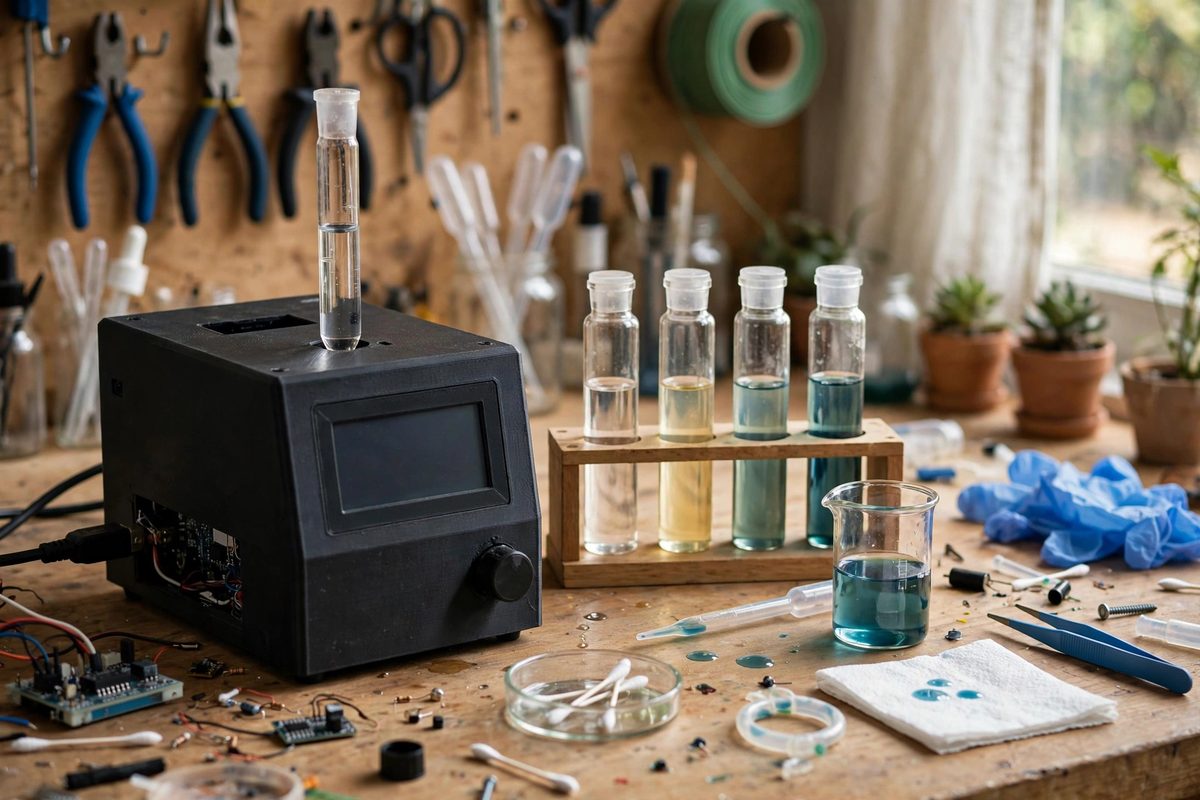
What optical density actually measures
Optical density, or absorbance, is the logarithm of the ratio of incident light to transmitted light at a chosen wavelength. A sample that transmits half the light has an absorbance of about 0.3; one that transmits a tenth has an absorbance of 1.0. The logarithmic scale matters because it makes absorbance proportional to concentration over the instrument's linear range, which is the entire basis of quantitative work. Outside that range the proportionality breaks: at very high absorbance, stray light and detector limits flatten the response, and at very low absorbance, noise dominates. Knowing where your setup is linear is not advanced technique. It is the difference between measuring and guessing.
The blank: your zero point
Every measurement session starts with a blank: a vial containing everything except the analyte, the solvent, the reagents, the medium, in the same vial type you will measure in. The blank zeroes out absorbance from the vial glass, the solvent, and the reagents themselves, so the reading reflects only what you added. Prepare the blank fresh each session, handle the vial by its upper rim or cap to keep fingerprints off the optical path, and wipe the vial's sides clean before inserting it. Re-blank whenever conditions change: new batch of vials, new reagent lot, or a long session where the lamp may have drifted. A measurement is always a comparison against its blank, and a stale or sloppy blank corrupts every reading that follows.
Standards and the calibration curve
To convert absorbance into concentration, measure a series of standards: known concentrations spanning the range you expect in your samples, prepared with the same care as the samples themselves. Plot absorbance against concentration and check for linearity; a good calibration gives a straight line through the origin region with a high correlation. The slope of that line is your working conversion factor. Prepare at least five standards bracketing the expected range, because two points define a line but reveal nothing about linearity, and include a standard near the detection limit to characterize low-end behavior. Make standards fresh; degraded standards produce a calibration curve that is confidently wrong, which is worse than no calibration at all.
Vial variability and handling
Vials are not optically identical. Wall thickness, glass clarity, and scratches vary between vials and even around a single vial's circumference. For the most consistent work, use matched vials from the same lot, orient each vial the same way in the holder, and consider dedicating specific vials as your blank and standards set. Inspect vials before use: reject scratched, chipped, or cloudy ones, since each defect adds its own absorbance. Fill vials to a consistent level, because the light path should pass through sample, not through the meniscus or the headspace. Small disciplines, applied consistently, remove the vial-to-vial variation that otherwise masquerades as sample variation.
Wavelength selection and interferences
Measure at the wavelength where your analyte absorbs most strongly and everything else absorbs least; that choice maximizes sensitivity and minimizes interference. If you are following a published procedure, use its specified wavelength. If you are developing your own, scan across the available range with a concentrated standard to find the absorbance peak. Be aware of what else in the sample absorbs at your wavelength: a colored medium, a side product, or turbidity from particles all add absorbance that the calibration curve will misattribute to your analyte. Turbidity deserves special caution, since scattered light reads as absorbance and varies with particle size; for turbid samples, consistency of preparation matters as much as the optics.
Verifying and maintaining calibration
Calibration is not permanent. Verify it each session by measuring a mid-range standard as an unknown; if the calculated concentration matches the known value within your tolerance, the calibration holds. Track these verification readings over time in a logbook. A slow drift in the verification values signals lamp aging, detector drift, or optical fouling, and tells you maintenance is due before the data goes bad. Recalibrate fully after any instrument service, lamp replacement, or change in vial type. And always record the calibration details with your data: date, standards used, wavelength, blank description. A measurement without its calibration context is a number without a meaning.
Calibrate optical density work with fresh blanks, a proper standard curve, matched and well-handled vials, the right wavelength, and session-by-session verification. The instrument gives you absorbance. The calibration discipline turns it into knowledge.
Related Guides
- Spectrophotometer Drift Correction in Educational Kits: Educational spectrophotometers, the build-it-yourself kits that let students measure color and concentration with light, are wonderful teaching tools
- Spectrophotometer Cuvette Drift in Educational Labs: Educational spectrophotometers are workhorses, but their readings drift, and the cuvettes are often the culprit. A scratched, fogged, or mismatched
- Titration Setup Accuracy in Home Chemistry Kits: Titration, the careful addition of one solution to another until a reaction completes, is the classic quantitative chemistry technique, and home kits
- Colorimeter Path Length Calibration in Home Photometers: A home-built photometer measures chemical concentrations by shining light through a sample and measuring how much is absorbed: more absorption means